
When you're looking at a potential investment property, it's easy to get swept up in the moment. But relying on a "gut feeling" is one of the quickest ways to make a costly mistake. That's where a rental property investment calculator comes in—it's the single most important tool for swapping emotion for hard data.
This isn't just about plugging in numbers. It's about projecting your actual cash flow, return on investment (ROI), and the overall health of a deal before a single dollar of your own money is on the line. It's how you spot a winner and, more importantly, how you avoid the duds.
Why Top Investors Never Skip the Calculator
In the real estate world, emotion is the enemy of profit. A property might look perfect on the surface or "feel" like a great opportunity, but those feelings won't cover the mortgage or an unexpected repair bill. This is precisely why a rental property investment calculator is non-negotiable for serious investors. It forces you to look at the numbers, plain and simple.
The pros treat every potential purchase as a business transaction, and running the numbers is their first line of defence. It gives you a clear, objective framework to compare different properties side-by-side, so you're always making a decision based on facts, not feelings.
Avoiding the Emotional Purchase Trap
Let me paint a picture for you—one I've seen play out countless times. An investor finds a charming duplex in a fantastic neighbourhood. They get that "good feeling" and, swept up in the excitement, they just skim the expenses. They figure the rent will easily cover everything. Easy peasy, right?
Wrong. A few months in, reality hits hard. The property taxes were higher than they guesstimated. An unexpected plumbing issue completely wiped out their cash reserves. And finding that second tenant? It took a month longer than they'd planned. Suddenly, they're dealing with negative cash flow every single month—a financial headache a quick five-minute calculation could have easily predicted.
A common target for many seasoned investors is an ROI somewhere between 8% and 12%. Without a calculator, trying to hit that benchmark is just a shot in the dark. You're leaving your financial future completely to chance.
This isn't just a story; it's a common trap. The thrill of finding a potential deal can create massive blind spots, causing you to gloss over small expenses that, over time, add up to a mountain of debt.
Stress-Testing Your Investment
A great rental property calculator does more than just tell you if a deal works under perfect conditions. Its real power lies in its ability to stress-test your investment against real-world surprises.
What happens to your cash flow if interest rates jump before you lock in your mortgage? How does a 10% vacancy rate, instead of an optimistic 5%, affect your bottom line for the year?
By running these "what-if" scenarios, you get a clear picture of how resilient your investment truly is. You'll quickly identify the property's financial breaking points and learn how to build a portfolio that can actually weather market storms. It transforms the calculator from a simple math tool into an essential strategic asset, ensuring every move you make is built on a solid foundation of numbers, not just a hunch.
Gathering Your Essential Data for Accurate Projections
A rental property calculator is an incredible tool, but let's be honest: it’s only as good as the numbers you plug into it. To get from a vague "what if" scenario to a projection you can actually build a strategy around, you need to roll up your sleeves and gather some specific, real-world data for the property you're eyeing.
Think of it like being a detective. Your first job, before you even open the calculator, is to piece together a complete financial picture of the deal. This goes way beyond just the asking price and what the seller claims the rent is.
Purchase and Financing Details
First up are the big, foundational numbers—the ones that form the very base of your investment.
- Purchase Price: This one's easy. It's the sticker price of the property.
- Closing Costs: Don't let these sneak up on you. A good rule of thumb is to budget for 2% to 5% of the purchase price to cover all the legal fees, title insurance, and other miscellaneous costs.
- Down Payment: How much cash are you bringing to the table? This figure is a major driver of your loan amount and, ultimately, your cash-on-cash return.
- Interest Rate & Loan Term: Your mortgage is going to be one of your biggest recurring expenses. Get a pre-approval or chat with a mortgage broker to lock down a realistic interest rate. You can also play around with our mortgage payment calculator to see how even small changes in the rate can impact your monthly payment.
Operating Expenses: The Hidden Killers
This is where so many new investors stumble. Underestimating your operating expenses can turn a deal that looks great on paper into a serious money pit. You absolutely have to find the real numbers, not just rely on generic percentages or what the seller tells you.
Pro Tip: Never, ever take the seller’s expense sheet at face value. Always do your own digging. Pull property tax records directly from the local municipality’s website and get your own landlord insurance quote. Verify everything.
Here’s the list of critical operating expenses you need to track down:
- Property Taxes: Head to the local municipal or county assessor’s website. You can usually find the exact annual tax bill for the property right there. Don't trust the MLS listing; it's often outdated.
- Homeowners Insurance: Call an insurance provider and get a real quote for a landlord policy. It's different—and often more expensive—than a standard homeowner's policy.
- HOA Fees: If the property is part of a homeowners' association, you need the exact monthly or annual fee. No guessing.
- Vacancy Rate: I can't stress this enough: always assume your property will be empty sometimes. A conservative vacancy estimate of 5% to 8% of the annual gross rent is a safe place to start. A 0% vacancy rate simply doesn't exist in the real world.
- Repairs & Maintenance: Things break. Budgeting 1% to 2% of the property’s value (not the rent) annually is a smart move. This covers everything from a leaky faucet to saving up for big-ticket items like a new roof or HVAC system down the road.
To illustrate, consider the California market. Recent reports show the median home price for existing single-family homes in early 2024 was around $806,000. An investor must balance this high entry cost against the state's average rent to determine if a property will cash flow, reinforcing the need for precise calculations.
Essential Data for Your Rental Property Calculator
Before you start crunching numbers, it's wise to have all your key financial figures gathered in one place. This checklist will help you make sure you haven't missed anything critical for an accurate analysis.
Data PointWhere to Find ItPro TipPurchase PriceReal estate listing (MLS, Zillow, etc.)This is your starting point for all calculations.Down PaymentYour personal savings/investment capitalCalculate this as a percentage of the purchase price (20%, 25%, etc.).Interest RateMortgage pre-approval, lender quotesShop around! A lower rate can save you thousands over the loan's life.Closing CostsLender's estimate, title companyAsk your real estate agent for a realistic local estimate (2-5% of price).Property TaxesLocal municipal/county assessor's websiteNever rely on the listing's info; pull the official record yourself.Home InsuranceInsurance agent quoteBe specific that you need a "landlord policy," not a standard homeowner's one.Gross Monthly RentRentometer, Zillow, local property managersResearch comparable properties in the immediate area for a realistic figure.Vacancy Rate %Your own conservative estimateStart with 5-8%. In a tougher market, you might even go to 10%.Repair Budget %Your own conservative estimateUse 1-2% of the property's value annually, not the rent.HOA FeesHOA documents, listing agentIf applicable, get the exact monthly or annual amount. This is non-negotiable.
Having this table filled out before you begin will make the process smoother and your results infinitely more reliable. It's the foundational work that separates successful investors from the ones who rely on hope.
Making Sense of the Key Performance Metrics
Once you've plugged in all your numbers, the real magic of a rental property investment calculator happens. It takes that raw data and turns it into actionable insights. The calculator doesn't just give you a simple "good" or "bad" verdict; instead, it generates several key performance indicators (KPIs). Each one tells a different, crucial part of your potential investment's story.
Let's break down the most important metrics you'll be looking at. Getting a handle on the "why" behind each one is what separates a savvy investor from someone just guessing.
This visual shows the basic flow of information that powers these all-important calculations.
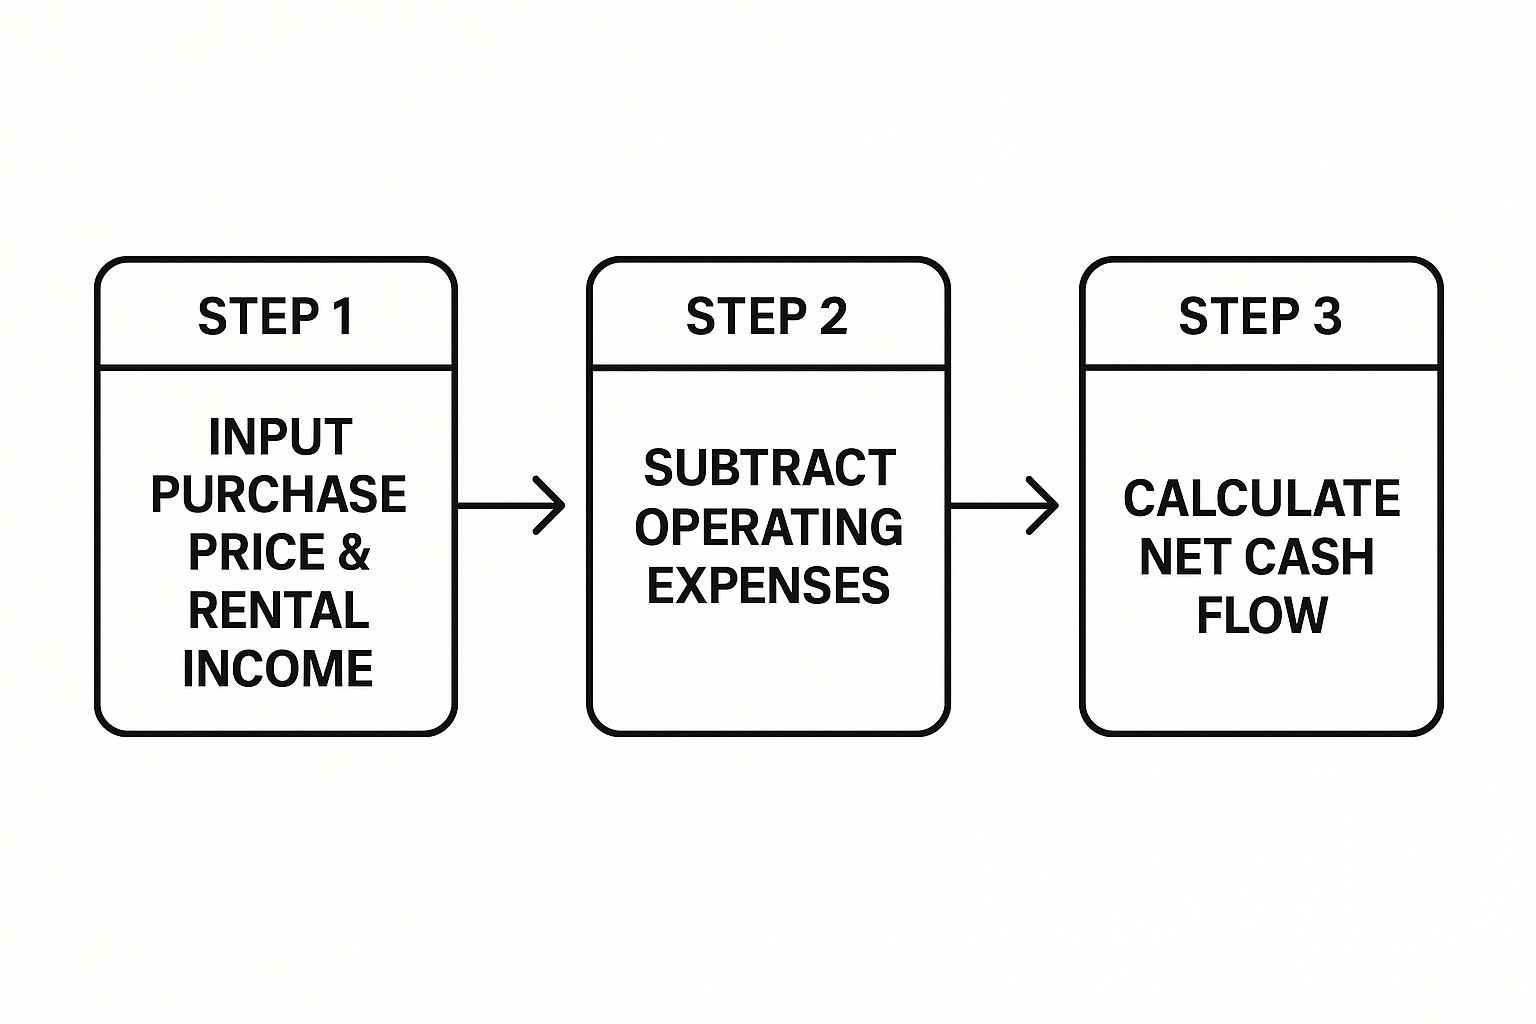
As you can see, everything starts with your income. Then, you subtract the costs, which leaves you with the cash flow—the foundation for many of the other metrics we're about to dive into.
Net Operating Income (NOI)
Think of Net Operating Income (NOI) as the purest measure of a property's ability to make money on its own. It's calculated by taking your total rental income and subtracting all your operating expenses—but here's the key part—before you factor in your mortgage payment.
Why does this matter so much? Because NOI strips away your personal financing choices and focuses solely on the property's performance. It lets you compare two different properties on an apples-to-apples basis, no matter if one was bought with cash and the other with a big loan.
Cash Flow
This is the metric that gets most investors really excited, and for good reason. Cash Flow is the actual money left in your pocket each month after all the bills are paid, and yes, that includes the mortgage. It’s simply your NOI minus your total mortgage payment (both principal and interest).
Positive cash flow means the property is not only paying for itself but also putting extra income into your bank account. On the flip side, negative cash flow means you're chipping in your own money every month just to keep it going. It’s the most immediate and vital sign of an investment's financial health.
A classic mistake I see new investors make is overlooking the small, recurring expenses that can quietly eat away at cash flow. Having a crystal-clear picture of your property's finances is one of the most important parts of being a successful landlord. For more tips, check out our collection of landlord resources to help you manage your investment like a pro.
Capitalization Rate (Cap Rate)
The Capitalization Rate (Cap Rate) is a fantastic tool for quickly comparing the potential return and associated risk of different investment properties. It's a straightforward but powerful formula:
Cap Rate = Net Operating Income (NOI) / Property Purchase Price
Generally, a higher cap rate points to higher potential returns, but it often comes with more risk. A lower cap rate might suggest lower returns but a safer, more stable asset—something you'll often see in high-demand, prime locations. There's no single "good" cap rate; it's all relative to the specific market you're investing in.
Cash-on-Cash Return
Last but certainly not least is the Cash-on-Cash Return. For any investor using financing, this is arguably the most important metric because it tells you exactly how hard your own invested cash is working for you.
Cash-on-Cash Return = Annual Pre-Tax Cash Flow / Total Cash Invested
Your "Total Cash Invested" isn't just your down payment. It includes your closing costs and any money you spent on initial repairs or renos to get the property rent-ready. For example, if you invest $50,000 of your own money and the property generates $5,000 in annual cash flow, your cash-on-cash return is a solid 10%.
This metric shows the direct return on your capital, making it an excellent way to measure how efficiently your investment is performing. Many seasoned investors aim for a return between 8% and 12%, but this can shift depending on your personal strategy and how much risk you're comfortable with.
How to Interpret Your Calculator Results

A rental property calculator is going to spit out a bunch of numbers, but those figures are just the start. The real skill comes from learning to read between the lines and turn that data into a smart investment decision. Figuring out what makes a "good" return isn't about chasing one magic number. It's all about context—your local market, your personal goals, and how much risk you're comfortable with.
The results from your calculator tell the property's true story. Is it a reliable cash-flow machine with okay appreciation potential, or is it more of a long-term equity play that might just break even month-to-month? Knowing how to read these metrics gives you the confidence to jump on a genuine opportunity and the clarity to walk away from a potential money pit.
Decoding Cap Rate in Your Market
The Capitalization Rate, or Cap Rate, is easily one of the most misunderstood metrics out there. There's simply no universal "good" Cap Rate; it's completely relative to the market you're buying in. A property showing a 4% Cap Rate could be an absolute steal in a high-appreciation market like Vancouver, where the main prize is long-term value growth.
But take that same 4% Cap Rate and drop it into a smaller, cash-flow-focused market, and it could be a major red flag. In those areas, investors need higher immediate returns to make up for slower appreciation, so they’re probably hunting for Cap Rates closer to 6-8%. You have to weigh your calculator's results against what's happening locally.
A property's story is told through its numbers. One of the most common pitfalls for new investors is failing to understand how metrics like Cap Rate and Cash-on-Cash Return relate to their specific market and personal financial goals.
The California housing market offers a perfect example of this. According to the California Association of Realtors' February 2024 report, home sales saw a slight recovery with a 12.8% year-over-year bump. But prices varied dramatically, from $375,000 in the Far North region to over $1.02 million in the Central Coast. This data highlights how tied a calculator's output is to location. A sky-high purchase price on the coast will naturally compress rental returns compared to more affordable inland properties. You can dig into these regional differences in the 2025 California housing market report.
Cash-on-Cash Return: Your Personal Profit Metre
While Cap Rate looks at the property itself, the Cash-on-Cash Return zeroes in on the investment from your personal point of view. It answers the most important question of all: "For every dollar I put in, how many cents am I getting back each year?"
This is where your personal strategy really comes into play.
- Chasing passive income? You'll want to see a higher Cash-on-Cash Return, probably 8% or more. This tells you the property is churning out healthy profits every month.
- Playing the long game? You might be perfectly fine with a lower return, maybe in the 4-6% range, if the property is in a rapidly appreciating neighbourhood where you expect to build serious equity over time.
Seeing these numbers in black and white helps you match a potential deal with what you actually want to achieve financially. We've heard from many clients how this clarity helped them build their portfolios with real confidence. You can check out what they have to say in our client testimonials.
At the end of the day, a rental property investment calculator gives you the data—your job is to use it to make an informed choice that fits your unique plan.
Advanced Strategies for Long-Term Projections
Getting a handle on the initial numbers for a property is a great first step, but a rental property investment calculator really proves its worth when you start looking down the road. Thinking in 5, 10, or even 30-year horizons completely changes your mindset. You're no longer just buying a property; you're building a resilient, wealth-generating asset. This is where you start to model the future.
It's all about moving beyond today's figures. A quality calculator lets you account for things like projected annual rent increases, property appreciation, and the slow but steady creep of expenses like taxes and insurance. This forward-looking view gives you a much richer, more realistic picture of a property's performance over its entire life.
Running What-If Scenarios
The real strategic power of a calculator comes from playing the "what-if" game. Real estate isn't a set-it-and-forget-it investment; it’s a dynamic market that can throw you a curveball when you least expect it. Your calculator is the perfect sandbox for testing how a property might hold up against financial stress.
You need to ask the tough questions and run the numbers to see what happens:
- Interest Rate Changes: What if mortgage rates jump by 1% or 2% right before you plan to refinance? How does that hit your monthly cash flow?
- Major Capital Expenses: An unexpected $15,000 roof replacement in year five can be a gut punch. How does that single event affect your overall profitability and wipe out your cash reserves?
- Extended Vacancy: Can your investment survive a three-month vacancy because the market cooled off or you had a tricky tenant turnover?
Running these kinds of scenarios shows you exactly where a property's financial breaking points are. It helps you build a proper buffer and create a strategy that isn’t just based on wishful thinking, but is genuinely prepared for reality.
An investment that only looks good under perfect conditions is a fragile one. By stress-testing your projections, you build a portfolio that can not only survive market turbulence but continue to thrive through it.
Comparing Long-Term Financing Options
Another smart way to use your calculator is for comparing different financing structures head-to-head. The decision between a 15-year and a 30-year mortgage, for instance, will have a massive impact on your investment journey.
A 30-year mortgage usually means lower monthly payments, which is great for maximizing your immediate cash flow. This is the go-to option if your main goal is to generate as much monthly passive income as possible.
On the other hand, a 15-year mortgage comes with higher monthly payments, but you build equity much faster and save a ton of money on interest over the life of the loan. This is a powerful play for investors focused on building long-term wealth and becoming debt-free sooner. A good rental property investment calculator lets you see these two paths side-by-side, making the trade-offs between cash flow now and equity later crystal clear.
For anyone investing in an active market, these long-term projections are absolutely essential. The California market is a perfect example. Investors there have to model for sustained housing demand, with some recent analyses showing average annual rent increases of 5-7% in major urban hubs. Factoring in high purchase prices and strong occupancy rates, which often sit above 95%, is crucial for an accurate long-term picture. You can see more on how these factors create a complex but promising environment in these California investment insights. Juggling all these variables over a decade or more is no small feat, which is why leaning on professional property management can be a crucial part of pulling off a successful long-term strategy.
Common Questions About Rental Property Calculators
Even when you feel like you've got a handle on the key metrics, it's totally normal to have some lingering questions when you're punching numbers into a rental property investment calculator. Getting clear on these common sticking points is what builds the confidence to pull the trigger on a deal.
Let's break down some of the most frequent questions I hear from investors during their analysis.
How Do I Accurately Estimate Future Maintenance Costs?
That old "1% rule"—where you just set aside 1% of the purchase price annually—is an okay starting point, but honestly, it's often way off the mark. A much sharper approach is to look at the specific property's age and condition.
For a shiny new build, a budget of 0.5% might be more than enough. But what about a 30-year-old property with its original roof and furnace? You'd be wise to budget closer to 2-3% each year. The best thing you can do is get a thorough home inspection and actually research the lifespan of the big-ticket items like the HVAC, water heater, and appliances. This lets you build a real Capital Expenditure (CapEx) budget, so one major repair doesn't gut your entire year's cash flow.
What Is a Safe Vacancy Rate for My Calculations?
I'll say this loud and clear: never, ever use a 0% vacancy rate. I don't care if it's the hottest rental market in the country; tenant turnover is just a fact of life for landlords.
A conservative and safe place to start is budgeting for 5% to 8% of your gross annual rent. To really dial it in, you need to research hyper-local data. For example, recent data from Moody’s Analytics showed national apartment vacancy rates ticked up to 5.0% in late 2023. If your local market is seeing a lot of new construction or has a highly seasonal economy, using an even higher rate like 10% is a smart, defensive move.
Think of cash flow as your salary and appreciation as a potential bonus. A strong investment should be profitable based on its own operations. Relying on future appreciation to make a poor-performing property look good is pure speculation, not sound investing.
Should My Calculator Include Property Appreciation?
It's always tempting to factor in those rising property values, but your core cash flow analysis needs to keep appreciation separate. The whole point of a rental property investment calculator is to figure out the property's operational health—the actual income it can generate on its own, month after month.
A truly great investment should stand on its own two feet, producing positive cash flow without any help from market speculation. This approach forces you to buy a fundamentally sound asset, not just gamble on future market growth. Keeping these two analyses separate gives you a much clearer, more honest picture of the deal's real strength.
Can I Use This Calculator for Short-Term Rentals?
While some of the financial ideas are similar, short-term rentals (STRs) like an Airbnb property need a completely different, much more specialized calculator. Your standard long-term rental calculator just isn't built to handle the unique variables of the STR world.
STRs have a whole different set of inputs, such as:
- Average Daily Rate (ADR) instead of a fixed monthly rent.
- Occupancy Percentage, which can swing wildly depending on the season.
- Higher, more varied expenses, like frequent cleaning fees, restocking supplies, and platform booking fees.
Trying to use a standard calculator for an STR will give you some seriously flawed numbers because it simply can't account for these critical nuances.
As you navigate the world of real estate, having the right information is key. For more local market insights and investment news, you can find valuable articles on our Brookside Property Management news page. If you're ready to take the next step in your investment journey, the team at Brookside Realty is here to provide the expert guidance you need. Contact us today to discuss your real estate goals.